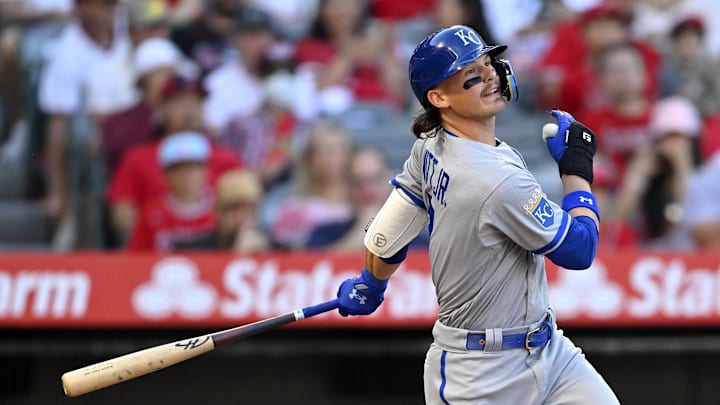
Advanced metrics continue to become everyday terms in the MLB realm. Stats like batting average, home runs, and RBIs will always catch the public's eye, but there are better metrics to measure how and where batters contribute the most. One such measurement is On-base Plus Slugging, or OPS. OPS combines a player's on-base and slugging percentages into one neat stat. It adds how well a player can simply reach base, while also factoring in how well they can hit for power. No matter how KC Royals fans slice the metric, the Royals remain second to last among all MLB teams.
KC Royals fans do not need advanced analytics to see how bad the bats are. But, the MLB standings by OPS validate fans' pessimism.
A slow offensive start has held the Royals back in 2023, but some offensive bursts on the road have buoyed their production. Their OPS rises by more than 100 percentage points on the road, while the Royals post a dreadful .554 OPS in Kauffman Stadium. The Royals' road trip is only a third of the way over, as they dropped a weekend series to the Los Angeles Angels. Hopefully, the Royals can find some offensive rhythm again before they return to Kansas City, for the fans' sake at least. The Royals faithful do not need any advanced analytics to see how slow Kansas City's bats have been 22 games into the season. But, the MLB leaderboard as of April 24 really visualizes how far the Royals are behind the curve.
MLB standings based on OPS:
1. Tampa Bay Rays: (.891)
2. Chicago Cubs: (.796)
3. Philadelphia Phillies: (.790)
4. Los Angeles Dodgers: (.787)
5. St. Louis Cardinals: (.782)
6. Texas Rangers: (.780)
7. Pittsburgh Pirates: (.765)
8. Atlanta Braves: (.763)
9. Boston Red Sox: (.763)
10. Milwaukee Brewers: (.742)
11. Baltimore Orioles: (.741)
12. New York Mets: (.732)
13. Toronto Blue Jays: (.732)
14. San Francisco Giants: (.730)
15. Arizona Diamondbacks: (.729)
League Average: (.721)
16. Angeles Angels: (.720)
17. Houston Astros: (.718)
18. New York Yankees: (.706)
19. Miami Marlins: (.700)
20. Chicago White Sox: (.691)
21. Minnesota Twins: (.682)
22. Seattle Mariners: (.682)
23. Colorado Rockies: (.680)
24. San Diego Padres: (.680)
25. Cleveland Guardians: (.668)
26. Cincinnati Reds: (.656)
27. Washington Nationals: (.653)
28. Oakland Athletics: (.649)
29. Kansas City Royals: (.606)
30. Detroit Tigers: (.596)
This is far from the only metric in the league where Kansas City nearly ranks last. The slow and frustrating offensive production has certainly been a massive contributor to their 5-17 record, which is last in the AL Central and one of the worst starts in franchise history. Only four Royals batters, like Matt Duffy (.919 OPS) and Vinnie Pasquantino (.875 OPS), rank well above the league average of .721 OPS. The remaining 11 batters that have appeared for Kansas City this year are below average, and some incredibly so. As the season goes along, some of these batters will move on to new teams or back to the minor leagues. If fans want a good metric to judge how an individual batter is doing, OPS is a great start to tell most of the story.
