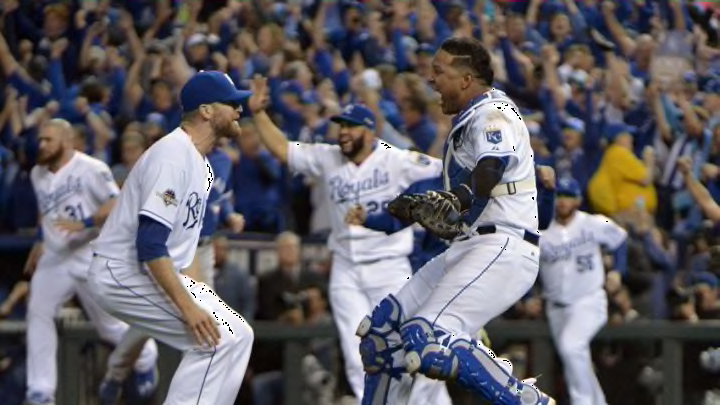
Wade Davis was as good in 2014 and 2015 as any relief pitcher in history. Is that sustainable?
As the Kansas City Royals enter Spring Training, Kings of Kauffman will release a series of articles on the 25-man roster. We will be going through each individual player, including the locks, bubble players, and a few prospects. We will progress through the roster from the top down, continuing with the bullpen.
So far, we have looked at Yordano Ventura, Edinson Volquez, Ian Kennedy, Chris Young, Danny Duffy, Kris Medlen, Mike Minor, Luke Hochevar, Brian Flynn, Scott Alexander, Kelvin Hererra, and Joakim Soria
Today, we will be looking at Wade Davis
All statistics provided by Fangraphs, Baseball Reference, and Brooks Baseball
"2015 stats – 8-1, 0.94 ERA, 78 SO, 20 BB, 0.79 WHIP, 2.29 FIP, 17 SV2016 Steamer – 4-3, 2.72 ERA, 72 SO, 21 BB, 1.12 WHIP, 3.05, 30 SV FIP"
Projected Role – Closer
2015 Results
I would start this of by complaining about Davis’ ZiPs and Steamer projections, but seriously, are we that spoiled?
I would put a little bit more stock into his ZiPs than his Steamer, which has him striking out 31% of his opposing batters and projects an ERA+ of 174. If that is anybody’s 2016 production not named Wade Davis, Kansas City would be licking their collective chops.
More from KC Royals News
- KC Royals Rumors: Is a monster move in the cards?
- KC Royals Free Agent Hunt: 3 Tampa Bay pitchers
- Grading the 2022 KC Royals: The $25 million man
- KC Royals Winter Meetings Tracker: Expectations met
- KC Royals Winter Meetings Tracker: Day 3 update
However, the Wade Davis that people will be expect is one of historic proportions. In fact, no pitcher has ever had an ERA as low as Davis’ in 2014-2015 (0.97) over a two year span in baseball history (min. 100 IP). Comparing Davis to only his 2015 peers is borderline unfair.
Davis’ ERA- (think ERA+, except going in the opposite direction; where 100 remains average) was a ridiculous 23, with the next closest being 37. His ERA+ figure is even more ridiculous, sitting at 444. The next highest I could find (and I may have missed somebody) was Darren O’Day at 274.
Two-Hundred-and-Seventy-Four.
For those of you counting at home, that means Davis outran the field in this metric by 62%. ERA+ is by no means an end-all-be-all stat, but that is absurd.
Among other things, Davis paced the field in ERA (0.94), BAA (.043), and wins (8), as well as being a top ten reliever in LOB% (92.%), WHIP (0.79), and WAR (2.0) Overall, hitters put together a measly .451 OPS against Davis.
So why is he being underrated in 2016?
2016 Expectations
Underrated may be a strong word, but he is definitely unappreciated. In Bleacher Report’s ranking of 2016 relief pitchers, Davis came in at eight, saying that he took “more steps back in 2015 than his sparkling 0.94 ERA would suggest.”
The explanation?
A combination of a lack of control (8.0 BB%), a decline in strikeouts (31% K% compared to 39% in 2014), and higher amount of contact (74% contact% compared to 69% in 2014).
And for the most part, the numbers are correct.
Even though his BB% actually decreased in 2015 from 2014, it still ranked among the bottom half of qualified relievers. And hitters did make more contact against Davis in 2015, but as the article says, that contact was hardly ever solid.
The biggest reason why Davis is underappreciated as a dominant reliever, however, is his strikeout numbers, which did take a significant hit in 2015. On the surface, we see that he struck out 31 fewer batters in 2015 than he did in 2014, in basically the same amount of innings (72 in 2014 to 67.1 in 2015). This explains a lot in the Davis narrative.
Don’t get me wrong. I’m not under any impression that people don’t respect Davis as an elite reliever. I don’t doubt that. However, Davis has been the best reliever in baseball for the last two years, putting together consecutive seasons that could both be argued for as the greatest individual seasons for a relief pitcher of all time.
Much of the reason that possibility gets bypassed is because Davis doesn’t strike out hitters at the same rate that an Aroldis Chapman, Andrew Miller, or Dellin Betances does.
Which helps us understand two things. First, strikeouts are a very influential player in individual projections. This explains why Davis isn’t being projected to repeat his other worldly production once again. And that’s not even a bad thing.
Projection systems, as I have talked about in past articles, are 100% numbers driven and not educated guess’ as much as they are the most probably result. What is the one thing that a pitcher can truly control on the field? Strikeouts. With strikeouts, BABIP, hard contact, soft contact, HR/FB, LD%, all of those metrics go out the window.
We see a similar phenomenon with walks. In 2015, 60 batted balls left the bat at 115-119 MPH, and only 46 wound up being hits. Of the 469 issued throughout Major League baseball in 2015, 469 reached base safely.
The strikeout is the most full proof out in baseball, so pitchers who strike more hitters out control a better portion of their own destiny.
With that being said, Davis is still an absolute monster and given that all of his pitch values were nearly identical in 2015 to 2014, it wouldn’t be a stretch to see his strikeout numbers jump in 2016.
Needless to say, the back end of the Royals bullpen should be pretty good.
