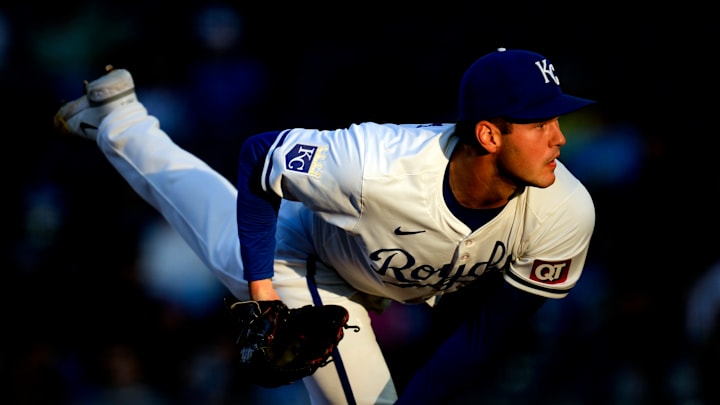
61.1 - Highest Game Score
Developed by renowned baseball mind and statistician Bill James, Game Score is a rolling metric that grades a starting pitcher's performance. A Game Score is calculated by factoring in both the excellence (based on runs, hits, HR, walks, and strikeouts) and duration (innings) of the starting pitcher's play. Given that 50 is the average mark on the scale, Ragan's above-average mark across 16 starts speaks to his consistency in a Royals uniform.
The Game Score operates on a scale typically ranging from 0 to 100, with an average performance scoring around 50 points. A pitcher starts off with 50 points. Points are then added or subtracted based on the pitcher's performance during the game:
- Additions: A pitcher earns one point for each out made, two points for each inning completed after the fourth, and one point for each strikeout.
- Subtractions: Two points are deducted for hits and unearned runs, with one point for walks and four points for each earned run.
For example, Ragans earned a 42 Game Score for his Aug. 12, 2023, start against the St. Louis Cardinals. He allowed three earned runs in six innings that day, but walked four batters to only five strikeouts. Conversely, he had two games with a 79 Game Score last season. Both his Aug. 29 and 29 starts were shutouts, but he pitched one more inning on Aug. 29 while striking out more batters in the Aug. 23 start.
This is a minute stat, and I understand if you roll your eyes at this entry. But Ragans leads several notable Kansas City pitchers with his average Game Score (so far).
Player | Average Game Score | Starts |
|---|---|---|
Cole Ragans | 61.1 | 16 |
David Cone | 59.1 | 57 |
Bret Saberhagen | 56.6 | 226 |
James Shields | 56.4 | 68 |
Kevin Appier | 55.5 | 275 |
Dennis Leonard | 53.5 | 302 |
