Kansas City Royals: Why the Royals have a real chance for the playoffs
The 2020 MLB season is up for anyone to grab. Including the Kansas City Royals, who have a strong case to be made for why they could make things interesting in the Central.
Now that the 2020 MLB season is officially beginning again, things are more interesting than ever for every team. The number one reason being, it literally could be anyone who makes it all the way, including the Kansas City Royals.
When the rules and guidelines started becoming public, one of the questions not revolving around players’ safety was who they would play. For the Royals this year, they will play their American League Central opponents, per usual, 10 times each. However, they will also be playing the National League Central teams as well. The Boys in Blue will be playing the Chicago Cubs and Cincinnati Reds four times each, Pittsburgh Pirates and Milwaukee Brewers three times each, and in-state rival St. Louis Cardinals six times this year.
For those doing the quick math, or for those who haven’t been paying attention to the world of baseball, that equates to a 60 game season. 102 fewer games being played this year compared to the normal 162 game season.
What does this mean for the Royals?
Players and coaches have to function differently this year. The normal “it’s a marathon, not a sprint” mentality, or the notion that a team can have a bad week or two but still bounce back is far from reality now. Every team needs to come out swinging, literally.
While it’s no hidden secret that the Royals have notoriously started the year slow, that might not be the case for them this year. Playing against the division more, and less against outside divisional teams could benefit the Royals.
Offensively
Some of the Royals seem to love playing against divisional teams. When looking at the Royals, they may have enough firepower on the offensive side of the ball to help push them over the top.
Here are the statistical breakdowns of all the offensive players the Royals against AL/NL Central teams in 2019.
Infield:
- Ryan McBroom: 13 games, .264/.316/.302, 2 doubles
- Cam Gallagher: 24 games, .262/.343/.415, 4 doubles, 2 hr
- Ryan O’Hearn: 48 games, .246/.342/.486, 6 doubles, 9 hr
- Adalberto Mondesi: 43 games, .223/.249/.394, 9 doubles, 6 triples, 4 hr
- Nicky Lopez: 52 games, .223/.263/.287, 7 doubles, 1 triple, 1 hr
- Maikel Franco: 31 games, .198/.257/.307, 8 doubles, 1 hr
Outfield:
- Whit Merrifield: 80 games, .332/.374/.500, 25 doubles, 4 triples, 8 hr
- Jorge Soler: 80 games, .298/.392/.653, 17 doubles, 28 hr
- Hunter Dozier: 68 games, .271/.337/.562, 10 doubles, 7 triples, 17 hr
- Alex Gordon: 75 games, .262/.345/.375, 10 doubles, 7 hr
- Bubba Starling: 30 games, .188/.234/.267, 2 doubles, 2 hr
- Brett Phillips: 11 games, .087/.185/.130, 1 double
A lot still needs to be taken into consideration. The number of games played against opponents, how often the player started verse if he was a pinch hitter, and what teams they played against being the main considerations.
Let’s try and make a hypothetical lineup based on these players.
- C: Gallagher – .262/.343/.415
- 1B: O’Hearn – .246/.342/.486
- 2B: Lopez – .223/.263/.287
- 3B: Franco – .198/.257/.307
- SS: Mondesi – .223/.249/.394
- LF: Gordon – .262/.345/.375
- CF: Merrifield – .332/.374/.500
- RF: Dozier – .271/.337/.562
- DH: Soler – .298/.392/.653
When looking at this lineup, the Royals have five players who hit .260 or higher.
If you take into consideration the small run that O’Hearn made at the end of the year when he was recalled from Triple-A, he was hitting .263/.354/.754 with more power and consistency than when he started the year.
Something to consider as well, in 2019, the average slash in baseball was .252/.323/.435, which is about what it has been since 2010. Therefore, over half the Royals lineup would be considered “above” league average when facing AL/NL Central teams.
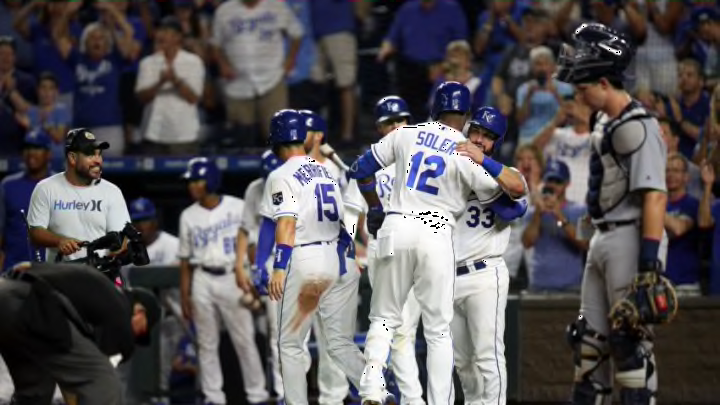
Royals pitching
When looking at the Royals pitching, here is how the pitching staff performed in 2019 against both AL Central teams and the St. Louis Cardinals.
Starting Rotation
- Brad Keller: 100.1 IP, 2.88 ERA, 73K/40BB
- Jakob Junis: 86.1 IP, 5.12 ERA, 87K/26BB
- Mike Montgomery: 31.1 IP, 5.50 ERA, 27K/7BB
- Danny Duffy: 40.1 IP, 5.61 ERA, 32K/15BB
Bullpen:
- Glenn Sparkman: 73.1 IP, 6.40 ERA, 49K/22BB
- Jorge Lopez: 68.0 IP, 6.09 ERA, 59K/23BB
- Scott Barlow: 34.1 IP, 3.70 ERA, 40K/17BB
- Ian Kennedy: 30.2 IP, 3.58 ERA, 36K/8BB
- Kevin McCarthy: 28.2 IP, 5.74 ERA, 22K/11BB
- Tim Hill: 23.0 IP, 1.57 ERA, 23K/7BB
- Jake Newberry:14.2 IP, 3.17 ERA, 16K/10BB
- Josh Staumont: 10.2 IP, 3.53 ERA, 5K/5BB
- Kyle Zimmer: 9.2 IP, 6.85 ERA, 8K/9BB
- Heath Fillmyer: 9.0 IP, 5.00 ERA, 8K/5BB
- Randy Rosario: 8.0 IP, 4.50 ERA, 4K/2BB
- Gabe Speier: 5.1 IP, 3.53 ERA, 6K/5BB
- Richard Lovelady: 4.1 IP, 21.95 ERA, 3K/4BB
- Trevor Rosenthal: 4.0 IP, 11.25 ERA, 3K/7BB
- Chance Adams: 4.0 IP, 13.50 ERA, 3K/3BB
- Jesse Hahn: 2.2 IP, 8.18 ERA, 3K/2BB
Similar to the offensive numbers though, you have to take sample size into consideration. As you can see, the bullpen has quite a few players who have minimal numbers against the AL/NL Central teams.
And let’s be honest. The pitching for the Royals is probably the bigger area of question/concern than the offense and defense production will be. So where is the silver lining?
Diving into the pitching production
Thought process
Teams have to think differently this year. Especially with pitching. Since this year is a sprint, rather than a marathon, teams have to make analytical decisions quickly, and accurately.
How do they perform against AL/NL opponents? How did they perform during Spring Training? How do they perform in short inning bursts? These are the primary questions I believe should be considered when looking at pitching this year.
What, when, how, why
Let’s operate under the guidelines of having just 13 pitchers. Right out of the gate, four spots are being used by starters Keller, Duffy, Montgomery, Junis. Leaving nine openings. We can go ahead and put Kennedy, Rosenthal, McCarthy, Hill, and Lopez on this list. That leaves four open spots. Based on how Spring Training went, let’s operate under the assumption that those four spots are filled by Staumont, Singer, Barlow, and Lovelady. If we expand the list, the next pitchers to break in would most likely be Zuber, Rosario, Sparkman, and Holland.
So let’s go through the process:
How do they perform against AL/NL opponents?
Regardless of sample size, did the pitchers have success? Here are the 13 pitchers potentially breaking Summer Camp/Spring Training 2.0.
- Brad Keller: 100.1 IP, 2.88 ERA, 73K/40BB
- Jakob Junis: 86.1 IP, 5.12 ERA, 87K/26BB
- Mike Montgomery: 31.1 IP, 5.50 ERA, 27K/7BB
- Danny Duffy: 40.1 IP, 5.61 ERA, 32K/15BB
- Jorge Lopez: 68.0 IP, 6.09 ERA, 59K/23BB
- Scott Barlow: 34.1 IP, 3.70 ERA, 40K/17BB
- Ian Kennedy: 30.2 IP, 3.58 ERA, 36K/8BB
- Kevin McCarthy: 28.2 IP, 5.74 ERA, 22K/11BB
- Tim Hill: 23.0 IP, 1.57 ERA, 23K/7BB
- Josh Staumont: 10.2 IP, 3.53 ERA, 5K/5BB
- Trevor Rosenthal: 4.0 IP, 11.25 ERA, 3K/7BB
- Richard Lovelady: 4.1 IP, 21.95 ERA, 3K/4BB
- Brady Singer: N/A
We can’t lie to ourselves when looking at this. Excluding sample size, besides Keller, Hill, Barlow, Kennedy, and Staumont, the pitching did not have a lot of success last year against AL/NL Central teams. However, maybe another way of looking at the numbers could make things a bit easier to swallow.
How did they perform during Spring Training?
Plenty of Royals pitching had success during Spring Training. Even during the shutdown, we saw videos of pitchers throwing straight gas. Yes, we are looking at you Josh Staumont and your 104mph fastball.
While a couple did not have great Spring Training or were injured during the majority of Spring Training, others flourished.
- Danny Duffy: 2 games, 6.0 innings, 0.00 ERA, 9K/1BB
- Scott Barlow: 5 games, 5.1 innings, 1.69 ERA, 4K/1BB
- Kevin McCarthy: 5 games, 5.0 innings, 3.60 ERA, 6K/4BB
- Josh Staumont: 6 games, 6.0 innings, 0.00 ERA, 10K/3BB
- Trevor Rosenthal: 5 games, 5.0 innings, 0.00 ERA, 9K/0BB
- Richard Lovelady: 5 games, 4.1 innings, 0.00 ERA, 6K/0BB
- Tyler Zuber: 5 games, 6.0 innings, 1.50 ERA, 8K/1BB
- Randy Rosario: 6 games, 6.1 innings, 1.42 ERA, 3K/1BB
For those of you who are curious, these eight pitchers combined for 44.0 innings, 55K/11BB, and a 1.02 ERA during Spring Training. Say what you will about it “just being Spring Training” or the level of competition, being this dominant while working on location and certain pitches aren’t things to scoff at.
“But I only see one starter on this list”
And you would be correct. Keller, Montgomery, and Singer did not have great Spring Training overall. Junis was dealing with a back injury essentially all Spring Training as well, making just one appearance for one inning before being done. Which leads to my next question.
How do they perform in short inning bursts?
This is another component that you need to think about when it comes to the 60-game sprint. Typically, teams try and have starters push for six to seven innings, getting their “quality-start”, allowing teams to not blow through their bullpen and burn those pitchers arms out over a long season.
That, however, is under the premise of 162 games and starters making roughly 30 starts a year. With the season being just 60-games, teams could potentially, and should, function differently. Where a starting pitcher might go through a lineup three times, if the pitchers and teams play their cards right, they could get the starter out of the game after going through the lineup twice and still have great success throughout the year, which could play to be in favor of the Royals.
When looking at the Royals starters progression through the opponent’s lineup, here is how each pitcher performed against the AL Central, plus St. Louis Cardinal:
Keller:
- 1st plate appearance: .188/.255/.278
- 2nd plate appearance: .139/.244/.175
- 3rd plate appearance: .231/.316/.347
Duffy:
- 1st plate appearance: .222/.315/.476
- 2nd plate appearance: .345/.377/.586
- 3rd plate appearance: .136/.136/.273
Montgomery
- 1st plate appearance: .289/.304/.578
- 2nd plate appearance: .307/.342/.462
- 3rd plate appearance: .357/.357.643
Junis:
- 1st plate appearance: .304/.354/.467
- 2nd plate appearance: .215/.264/.393
- 3rd plate appearance: .216/.286/.304
What to make of the numbers
Assuming the Royals perform similarly this year as they did last year, this information shows exactly what was mentioned before. The starters, in small bursts, can be extremely effective. If the anticipation is that the Royals bullpen can be better than last year, and could be the beginning of another run like the 2013-2016 bullpen was, getting through the lineup twice could be enough.
Final Considerations
The Royals have 20 games split between the Cardinals, Pirates, Cubs, Brewers, and Reds. When looking at the NL Central as a whole, the Cardinals and Reds may be the hardest teams for the Royals. St. Louis is consistently at the top or contending in the NL Central, and Cincinnati has theoretically improved with the additions of Mike Moustakas and Nick Castellanos.
The Pirates, who have lost Chris Archer for the season, should be the easier of the teams for the Royals. Leaving the Brewers and Cubs in the middle of the pack, but both could easily be contending at the top of the division.
With 20 games total being played against the NL Central, if the Royals could at least split the games and get 10 wins total, that could be enough to make the Royals competitive for at least a Wild Card spot in the playoffs this year.
The Royals offense, defense, bullpen, and baserunning seem to be the strength of the team. With a new manager in the dugout, young, and energized players itching to make an impact, the Royals have all the makings of making this year fun and interesting for Kansas City. It’s just a matter of sprinting immediately out of the gate.