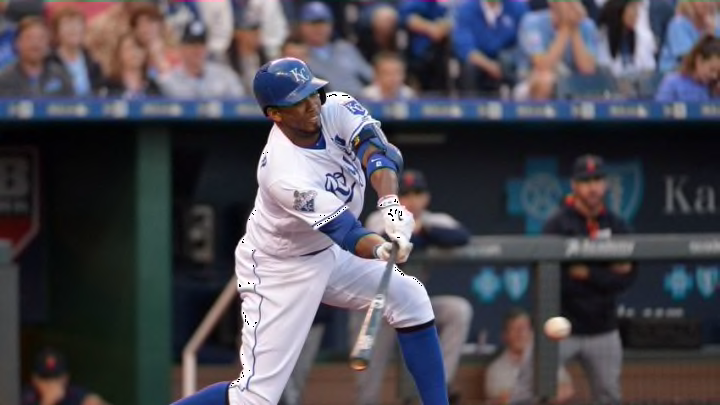
KC Royals: Alcides Escobar And The Lineup
The KC Royals are losing, which means second guessing from their fans goes hand in hand. In light of the Kansas City Royals five game losing streak, it’s time once again to take a look at the lineup.
So far, the 2016 lineup has been similar to the lineup the KC Royals featured in the 2015 regular season and post season. The batting order 1-9 has been Alcides Escobar, Mike Moustakas, Lorenzo Cain, Eric Hosmer, Kendrys Morales, Alex Gordon, Salvador Perez, Omar Infante, and Jarrod Dyson/ Paulo Orlando. Escobar hitting first has been a point of controversy going back to last year as he doesn’t fit the typical mold of a lead-off hitter.
Traditionally, the lead-off hitter is thought of as a “table setter”. The lead-off hitter is supposed to work the count allowing the following hitters to get a look at the arsenal of the opposing starter for that day. The lead-off hitter is also a guy who is able to frequently get on base setting up RBI opportunities for the middle of the order.
Statistically, a prototypical lead-off hitter would have a high on-base percentage (OBP), a decent speed rating, and see a lot of pitches per at bat.
Next: An Example Of A Good Leadoff Hitter
Adam Eaton Is A Good Leadoff Hitter
Adam Eaton of the White Sox is a good example. According to Fangraphs.com, Eaton had an OBP of .345 and saw an average of four pitches per plate appearance while stealing 18 bases in 2o15.
During the same year, Escobar had an OBP of .293 while stealing 17 bases and saw an average of 3.5 pitches per plate appearance. Half a pitch difference per plate appearance may not seem like a big difference, but it equates to about 337 more pitches given the same number of plate appearances by Escobar.
More from Kings of Kauffman
- KC Royals Rumors: Is a monster move in the cards?
- KC Royals Free Agent Hunt: 3 Tampa Bay pitchers
- Grading the 2022 KC Royals: The $25 million man
- KC Royals Winter Meetings Tracker: Expectations met
- KC Royals Winter Meetings Tracker: Day 3 update
The other factor to consider with lineup construction is the number of plate appearances each position in the lineup will get. A post by John Dewan at Bill James Online breaks down the average number of plate appearances by position in the batting order. The leadoff hitter averages 767 appearances per season while each subsequent hitter has an average of 17-18 fewer appearances each.
The number nine spot in the order averages 625 plate appearances per season. Thus, a big part of the logic behind putting the best hitters at the top of the lineup is that the manager wants the best hitters to have the most plate appearances.
We are well aware of the #EskyMagic effect explained by Kansas City Star writer Rustin Dodd in October of last year. The article notes that Ned Yost is well aware of the advanced metrics and what they say about who should lead off. But, at the same time, Yost cannot ignore that the KC Royals were 103-59 with Escobar leading off, and just 92-85 when he didn’t over the course of the two prior years.
Next: Did Esky Really Help At Leadoff?
Did Esky Really Help At Leadoff?
Were the Kansas City Royals winning because Escobar was leading off and he is some sort of catalyst that gets the offense going? Or, was it a multitude of factors and the KC Royals might have won in spite of Escobar leading off?
Were the Royals winning because Escobar was leading off? Or did the KC Royals win in spite of Escobar leading off?
The same post by John Dewan at Bill James Online highlights the difference in the average number of RBI opportunities each position in the lineup will have over the course of a season. Not surprisingly the numbers three, four and five hitters have the greatest number of RBI opportunities and therefore it makes sense for those positions to have the greatest ability to drive in runs.
It also makes sense to then fill the numbers’ one and two positions in the lineup with high OBP guys so that they have runners on to drive in. When a lineup is constructed in the most SABRE metrically friendly fashion, it becomes a bit of a self fulfilling prophecy that the middle of the order has the most runners on base when they come up since the manager put high OBP guys at the top of the lineup in the first place.
More from KC Royals News
- KC Royals Rumors: Is a monster move in the cards?
- KC Royals Free Agent Hunt: 3 Tampa Bay pitchers
- Grading the 2022 KC Royals: The $25 million man
- KC Royals Winter Meetings Tracker: Expectations met
- KC Royals Winter Meetings Tracker: Day 3 update
The Kansas City Royals however, are not the most SABRE Metrically friendly team. They typically do not walk much, and do not strikeout much, and put the ball in play a lot. The KC Royals also hit for a high average: in 2015 the Royals hit .269 as a team. The .269 average was good enough for 2nd in all of baseball and only .001 point behind the Tigers who were number 1.
Yet, the KC Royals only had one hitter in 2015, Lorenzo Cain, who hit over .300. The lowest average on the Kansas City Royals when you consider players who played in September of 2015, and the post season, was Alex Rios who was hitting .255.
What the KC Royals lineup statistics may imply is that there is a greater deal of parity up and down the lineup than other teams. This creates an environment where the middle of the order isn’t counted on to drive in as big a portion of the runs as other teams. If true, then the traditional value of the lead off hitter is reduced and Escobar leading off does’t cost as much in terms of run production than it would for other teams.
Next: KC Royals Slide A Reminder Of The Recent Past
However, there is no getting around the fact that the KC Royals player with one of the lowest batting averages and OBP is going to get at least 18 more plate appearances than Moustakas, and 72 more plate appearances than Eric Hosmer.