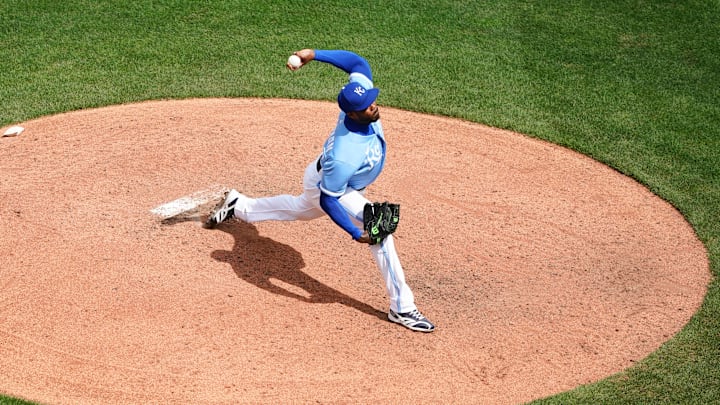
KC Royals fans and pundits will have a hard time finding a statistical metric in which the team is better than the league average. Sure, fans were berated with the Royal's hard-hitting prowess to start the season, something that continues into May. The options are scarce outside of that metric though. The team has limped through the month of April, ending with a 7-22 record and last place in the AL Central. Times are tough for the Royals, while the 2015 World Series pennant flies high.
The Royals' pitching staff has gone from the starters excelling and the bullpen failing, to the other way around in the span of 29 games. The offensive struggles have clouded the pitching struggles and slight improvements compared to the 2022 staff.
The KC Royals pitching staff has been mostly unspectacular. But, there is at least one metric they are better than average in.
Looking through MLB leaderboards, the Royals staff as a whole is slightly better than average in walks per nine innings or BB/9. Sitting at 3.4 BB/9 as a whole staff is above average, but not great for an individual measurement. FanGraphs would give them a poor rating, but certain pitchers are inflating the overall number. Starters Zack Greinke and Brady Singer are both in the great territory, with 1.7 and 2.0 BB/9 respectively. The team-leading metric is par for the course for Greinke, as the team's oldest pitcher. Meanwhile, starter Brad Keller has the worst BB/9 at 7.1. Closer Scott Barlow's 6.1 BB/9 would be the worst in his career if the season ended today.
The Royals 2022 pitchers posted a 3.7 BB/9 as a staff, giving the 2023 staff a slight edge so far in the season.
MLB standings based on BB/9:
Minnesota Twins 2.6
Los Angeles Dodgers 2.7
Cleveland Guardians 2.8
Texas Rangers 2.8
San Francisco Giants 2.8
Houston Astros 2.8
Toronto Blue Jays 2.9
Milwaukee Brewers 3.0
Detroit Tigers 3.0
Boston Red Sox 3.1
Seattle Mariners 3.1
Tampa Bay Rays 3.1
Atlanta Braves 3.1
New York Yankees 3.1
Baltimore Orioles 3.2
Kansas City Royals 3.4
Pittsburgh Pirates 3.4
League Average 3.4
Miami Marlins 3.5
Philadelphia Phillies 3.5
Chicago Cubs 3.5
St. Louis Cardinals 3.6
Washington Nationals 3.8
San Diego Padres 3.8
Los Angeles Angels 3.8
Cincinnati Reds 3.8
Colorado Rockies 3.9
Arizona Diamondbacks 4.0
New York Mets 4.1
Chicago White Sox 4.5
Oakland Athletics 5.3
The margin is razor thin but places the Royals on the right side of something at least. In a season where the Royals are already 15 games under .500, we will take what we can get.
